Investment Strategy : High Yield
OBJECTIVES:
The main objective of the High Yield Investment Strategy is to produce an annual income of 4%. In seeking to achieve this the portfolio will consist of a broad range of different income producing investments some of which will also have the potential to deliver capital growth over the medium to long term.
The portfolio will typically hold between 35% to 50% in lower risk investments and will not hold more than 15% in higher risk investments.
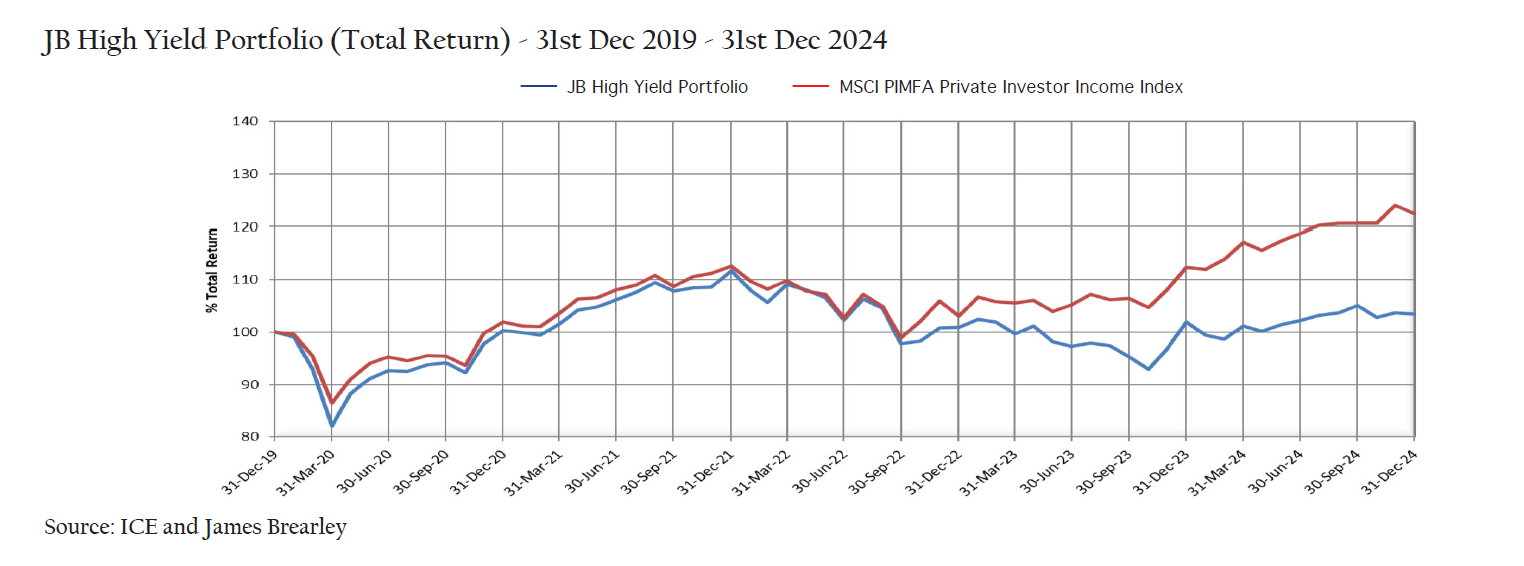
The portfolio is benchmarked against MSCI PIMFA Private Investor Income Index.
PERFORMANCE:
Cumulative Total Return Performance
| INDEX | 1y Total Return % |
3y Total Return % |
5y Total Return % |
10y Total Return % |
|---|---|---|---|---|
| JB High Yield Portfolio* | 1.46 | -7.41 | 3.41 | 37.10 |
| MSCI PIMFA Private Investor Income Index |
8.96 | 8.77 | 22.44 | 71.89 |
| Cboe UK All Companies Index | 9.88 | 20.56 | 26.81 | 82.70 |
| MSCI AC World Ex UK Index | 19.95 | 26.71 | 72.74 | 209.23 |
Discrete 1 Year Total Returns Performance
| INDEX | Dec 2024 Total Return % |
Dec 2023 Total Return % |
Dec 2022 Total Return % |
Dec 2021 Total Return % |
Dec 2020 Total Return % |
|---|---|---|---|---|---|
| JB High Yield Portfolio* | 1.46 | 1.01 | -9.65 | 11.31 | 0.34 |
| MSCI PIMFA Private Investor Income Index |
8.96 | 9.09 | -8.49 | 10.42 | 1.94 |
| Cboe UK All Companies Index | 9.88 | 7.65 | 1.92 | 18.02 | -10.87 |
| MSCI AC World Ex UK Index | 19.95 | 75.71 | -8.63 | 19.63 | 13.96 |
Source: FE Analytics and ICE. All performance figures shown are Total Return. As at 31st Dec 2024.
*Source: James Brearley
Total return performance has been calculated by adding in the projected income from the other positions being re-invested on a quarterly basis as part of a general re-balance exercise. Total return performance has been calculated up until December 2015 by assuming the receipt of a quarter of the projected income every 3 months with this being reinvested into two model positions at half yearly intervals.
Any performance information shown represents model portfolios which are periodically restructured and/or rebalanced. Although the model portfolios are representative of a client’s individual portfolio, the actual returns may vary from the model portfolio returns shown. In addition, model portfolio performance quoted does not take into consideration the cost of investing and /or management fees. The returns achieved by a client may be lower than the returns shown above. Although the model portfolios are representative of a client’s individual portfolio the asset allocation of and the investments held in a client’s individual portfolio may differ.

Asset Allocation Summary (31/12/2024) %
Overall Risk Summary (31/12/2024) %
CURRENT PORTFOLIO: TOP 10 LARGEST HOLDINGS
| Top 10 Largest Holdings | Weighting % |
|---|---|
| Man GLG Sterling Corporate Bond Professional | 7.5 |
| Royal London Global Bond Opportunities | 7 |
| Nomura Global Dynamic Bond | 6.5 |
| Fidelity Short Dated Corporate Bond | 6.5 |
| Vanguard Global Bond Index | 5 |
| Artemis Income | 5 |
| Man GLG Equity Income | 5 |
| MI Chelverton UK Equity Income | 4 |
| Royal London Global Equity Income | 4 |
| Guinness Global Income | 4 |
| Total | 54.5 |
IMPORTANT INFORMATION
Investing in stockmarket based investments may not be right for all investors. You should consider carefully and/or seek professional guidance before investing. Please remember that past performance should not be seen as a guide to future performance. The value of an investment and any income from it can fall as well as rise as a result of market and currency movements and you may not get back the amount you originally invested.


